Finance 3.0: Divergence vs Convergence and why trend following is a divergent approach
- Adaptive Alph

- Mar 28, 2020
- 9 min read
Divergent vs Convergent Trading Strategies
In reality, only two types of investment strategies exist. The first type of investment strategy is a convergent strategy that benefits from stable relationships between asset prices. Convergence is mean reverting in nature and could for example take place in the futures market when the future price of an underlying cash commodity moves towards the spot price or in the stock market when the value of a stock moves towards its true intrinsic value. The second type of strategy is a divergent investment strategy and it builds on unstable relationships between asset prices. Divergent strategies may be profitable when there is an underlying shift in the market that pushes the price of a stock away from its former efficient value and creates a new intrinsic value. This fundamental divergence is known as a paradigm shift and is due to a change in either endogenous factors such as regulation and a change in monetary policy or it is due to exogenous factors such as a virus and a natural catastrophe.
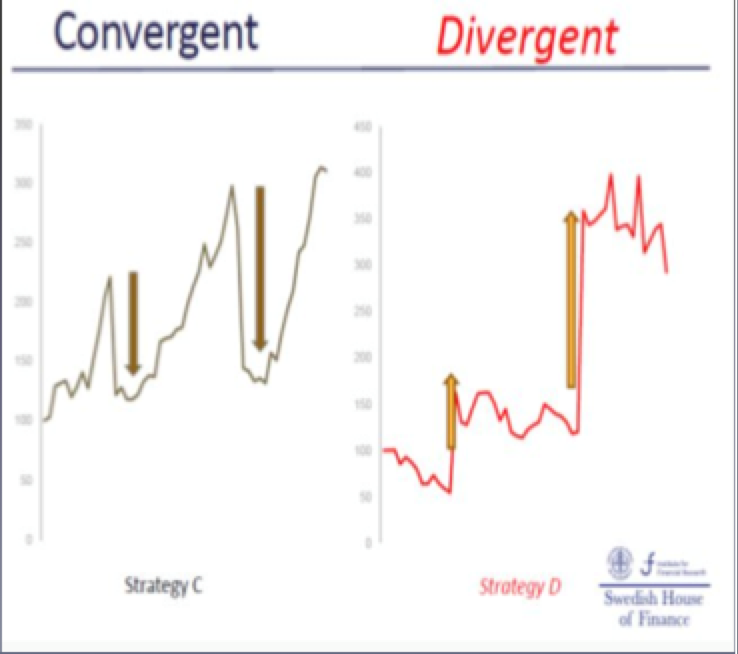
Above illustration demonstrates an important observation about convergent vs divergent investment strategies. In the blue graph, one can see that a convergent strategy profits most of the time, but not all the time. In the middle of the illustration, the convergent approach has two sharp 90 degree reversals in which losses occur. The divergent strategy, however, is almost the mirror opposite as it instead seems to trend negative in most periods and then has two sharp upswings in which the strategy profits massively. Holding a divergent strategy in periods when losses occur is psychologically difficult. One must fight instincts to sell in the frequent slightly bad periods and understand that divergency makes money in chunks.
Trend is an example of an investment strategy benefitting from the divergent factor
If investors placed all their investments on a convergence to divergence spectrum, my guess is that approximately 80-90% of a typical portfolio is based on a convergent approach meaning that if the markets are stable the portfolio performs well. The 90% convergent portfolio conclusion is accurate even if a portfolio diversifies across asset classes, as most trades tend to indirectly short volatility. For example, a traditional long only 60-40 portfolio is the textbook definition of a convergent strategy, despite diversifying across different sectors and maturities. This generally passive strategy generates a stable income in a normal market with low volatility through dividends from the growing equity portfolio and coupons from the fixed income portfolio. However, during a crisis period there is always a shock to the system and correlations across assets tend to approach 1 leading to most assets moving down together. If the crisis is prolonged, such as the dotcom bubble in early 2000s or the banking crisis in 2008, a divergent strategy like trend following drastically outperforms the market and therefore buffers the typical institutional portfolio. Adding trend creates a more stable overall portfolio, as the underlying approach to extracting return from inside asset classes must be balanced as well. Trend followers are generally agnostic to which markets that are most likely to trend and their portfolios can therefore trade more than 100 different markets across fixed income, equities, currencies and commodities.

Above illustration is from the CFA curriculum and depicts the performance of three different types of typical institutional investor portfolios. Portfolio D includes the CISDM CTA Equal Weighted Index, which is designed to broadly represent the performance of approximately 250 CTA programs in the Morningstar database that meet the inclusion requirements. As you can se, having10% of the portfolio invested in CTA's will enhance risk reward characteristics and shrink the max drawdown.
Why are trends caused?
According to the efficient market hypothesis, market prices reflect all available information. If markets are efficient then there is no mispricing and if there is no mispricing there is no investment strategy capable of extracting alpha. However, there are behavioral reasons for why prices are not efficient and Adaptive Alph believes there are two main reasons for why markets trend up or down. The first reason is explained through the adaptive market hypothesis (AMH), an alternative theory to EMH, which outlines human behavior as a cause for inefficient prices and trend. According to the AMH, markets overshoot or undershoot the equilibrium price when its participants adapt to new information. Two examples of behavior causing overreaction is herding and prospect theory explained in more detail below. Overreaction to bad news such as COVID-19 creates fear, which in turn causes significant up or down trends in the market that trend followers will then capitalize on. The second reason for why trend exist is that in the financial markets there are two types of investors - hedgers and speculators. The hedgers are willing to pay a premium to the speculators in order protect their assets. For example, a farmer could hedge the price of a physical asset such as wheat, on the futures exchange. On the other side of that transaction, there may be a hedge fund, such as a trend follower, speculating that the price will increase. In a so-called “normal” market, the spot price (current price) is less than the future price due to future price uncertainty and in exchange for absorbing the uncertainty the speculator demands a premium. That premium is an example of extracting alpha for taking on price risk in the market. If the uncertainty among farmers increases they are willing to pay a higher and higher price to protect their wheat and therefore causing a trending market.

The herd behavior by investors cause asset prices to trend.
· Herding behavior is a bias making individuals follow the “pack”. For example, it is a status symbol to have the latest iPhone, which in turn drives up the price of the iPhone to irrational highs. This happens in the market all the time. The price of bitcoin, marijuana stocks and tulips in the 1700s are just a few examples.
· Prospect Theory is a loss aversion bias that demonstrates how people respond differently to the prospect of losing and winning money. The prospect theory states that people are risk seeking and willing to gamble when there is a certainty of losing money. However, if there is a certainty of winning money then people are instead risk averse. This is best illustrated by an example. The expected return between winning 100 KUSD with certainty or 1 million USD with a 10% probability is the same at 100 KUSD. Most people would then choose to get a 100 KUSD with certainty. If you flip the experiment so that one will lose a 100 KUSD with certainty or have a 10% probability of losing a 1 million USD, then most people would choose to gamble. This difference in preference is dependent on how people emotionally respond to gains and losses. This type of behavior drives the markets away from the efficient price.

Above graph illustrates that we feel a loss of 100 GBP more than a gain of 100 GBP despite that the amount of gain and loss is equal.
How is a trend measured?
The simplest technique to measure a directional trend is the price break out strategy. For example, if the price of the S&P 500 is higher today than the price of S&P 500 3 months back, then the S&P 500 is in a positive trend. Another straightforward method to measure trend is to compare moving averages (MA) of the S&P 500 price with different time horizons or lookback periods. When the short 50 day MA is greater than the long 200 day MA of the S&P 500, then the S&P 500 is in a positive trend. The problem with these simple strategies is that they only measure the direction of the trend and fail to measure the strength of the trend. Pretend a comparison is made between the price curve of S&P 500 and Dow Jones. If the S&P 500 curve has a higher upward angle then a probable conclusion is that the S&P 500 is in a stronger trend than the Dow Jones. These elementary strategies also fail to measure the volatility and the full price history of the S&P 500 and Dow Jones price curves. If volatility is higher it means that the price curve fluctuates up and down at a greater pace and the trading cost of the simple system increase as the simple model will continue to quickly switch from long to short exposure. Also, only using one crossing MA lookback period such as a short MA of 30 days and a long MA of 100 days fails to account for the full historical price curve. As soon as 100 days have passed, the 101th day falls out of the trend analysis, which could have a great impact on trend strength. A more complex trend following model, however, will measure the strength of the price drift, estimate the volatility, incorporate skew, analyze kurtosis and account for the optimal historical price series of an asset.

The black line shows the price of an asset. The red lines show the support level (bottom line) and the resistance level (top line) of the price breakout strategy. The green circle depicts the buy signal of the trading system as the price breaks through the resistance level.
What is a more complex trend model?
Instead of using MA filters to measure trend, a great start is to exchange the MA filters with exponential moving average filters (EMAs) and double exponential moving average filters (DEMAs). The EMA filters place a greater weight on more recent data points in the historical price curve used for creating forecasting signals. Some EMAs when bunched together also include the full history of a time series, which could make for more accurate forecasts. The weight parameter in an EMA filter is set by a quant and is a potential differentiator in model development. EMAs generally create a more reactive price curve without any sharp edges leading to lower noise in the signal and less trading on small trend reversals. Another additional complexity statisticians and more advanced trend followers incorporate when reducing noise in the signal is an ensemble technique. The ensemble is a multivariate approach to statistical analysis such as trend following incorporating multiple different EMAs assigned with different weight parameters and lookback periods that are then varied when training/running the model. The ensemble is an effective way to budget risk as it prevents risk concentration to just one parameter that in turn generates the trend signal. The ensemble can also add covariance matrices to the signal generation in order to see how markets move together. If market A and B have historically correlated then having a strong exposure in both of these markets might be suboptimal from a risk adjusted return perspective as these two markets have a high likelihood of seeing sharp trend reversals at the same time. An additional complexity that adds to a robust trend following system is to utilize portfolio optimization to take stronger positions in those markets that have a higher probability of trending.

The Exponential MA is more reactive and follows actual price action of the asset more closely. If one looks at the peak of the blue price line in the middle of the illustration then one can see that the green EMA line increases and decreases at a faster rate.
What are some further complexities?
No matter the complexity of a trend follower, the goal is always to profit from riding optimal market trends. As a result, the trend following quant maximizes the probability of reaching the objective by deploying a complex statistical toolbox to locate trends. A recently developed technique for finding trends in the market is the basket approach. These baskets of instruments or markets are generally constructed so that the independent variables have a high correlation and consist of filtered historical market returns on the near future price development. Researchers then use dimension reduction techniques (DRTs) that in turn figures out the underlying factors that drive trend in markets of that basket. For example, a higher GDP growth in a country most likely boosts revenue for all companies in that country and GDP growth is therefore a principal component or underlying driver for equity markets. This example is called principal component analysis (PCA) and is a well established (DRT). By building baskets of instruments, the quant creates more favorable trend following characteristics than individual instruments or markets typically exhibit. Favorable means that the price curve is smooth, the direction of the trend is clear and other statistical moments such as skew and kurtosis have less of an impact. The exposure is then allocated to the markets that are being traded by that trend follower to imitate the basket exposure. This exposure is built based on the multiplication of the basket signals and their weights.
Finance 3.0 trend followers apply advanced statistical and mathematical techniques to capture momentum patterns in the market.
Conclusion
Most investors follow a convergent approach such as the classic 60-40 portfolio that profits in normal markets. Many of these convergent investors believe that markets are efficient, but AMH and the hedger-speculator hypothesis are alternative theories for why markets are not efficient. As a result, trends can occur when market participants overreact to new information. Historically, overreaction is more prone to occur when the market enters a new economic paradigm and when the market dynamic shifts correlation between asset classes tend to breakdown. When correlations breakdown, the convergent portfolio is unprotected even if the portfolio is diversified across asset classes. It is therefore smart for investors to allocate to investment strategies that are divergent in nature, which in turn truly differentiates how returns are extracted from within asset classes. Trend following is the textbook definition of a divergent strategy as markets must trend to find their new equilibrium price. Trend followers are often agnostic to which markets that will trend and it is therefore important to trade multiple markets. More complex trend followers are better suited to capitalize on trends than simple trend followers as complex trend followers incorporate more advanced measures to find optimal trend direction and strength while protecting against harm caused by noise, volatility, skew and kurtosis.
You finished!
Well done!
Stay adaptive!


Comments